Originally Posted by Lucinator

Here is the screenshot
|
Thank you for the screen shot.
Please take some time to use some common sense and simply observe your data from the guilds you are in. There may be some things you can do with real world applications of data like SAT scores for high school students to explain why there is a drop in their SAT scores compared to last year.
This is ESO and people just sell stuff to make gold.
The screen shot for the plating from my documentation was from September 2021. So at that time the data I had in my LibHistoire file produced that scatter plot. I have no control over what people sell things for currently.
Example #1

There is no way to draw the majority of the 2853 sales from that graph with any kind of normality whatsoever. The range of the highest to lowest price is 1 to 340 and the scale of the dots produces the results you are seeing. This is a perfect example of expected behavior based on the prices over one year with the data you have. Especially with the outliers I circled.
Example #2

With this scatter plot it's pretty obvious to me that the data from the guilds you are in, everyone sells things between 40 and 63 gold per, hoping someone will buy it. That's also pretty easy to deduce from that scatter plot. There should be no surprises here either and this is also expected based on your data you have collected from the guilds you are in.
Example #3

This image is with outliers trimming off.
I am a victim of the same situation as you. There are going to be people that will intentionally list things and either buy it from themselves on another account or work with someone to do so. This is also expected behavior on the part of certain individuals that I have no control over.
Example #4

This image has trimming outliers on and the data for this item is the only one I have that has any kind of normality to it. Again I can't control that.
Example #5

For this image I had to right click the dots and add 25 people to the Guild and Account filter to make it look like that.
What I see is that the mean with no outliers is 131 and the mean with all my adjustments is 116. However the graph shows the average for 90 days and the average has been lower in the past.
Example #6

The ten day average is 182 and that aligns with the previous graph with the high price being 180. Which is also somewhere between the 169 and 206 values from TTC.
I really encourage you to reduce the amount of data you store. You don't need to be the library of congress of data. I can do all of what I just did with only MM and using the focus keys. Because of the default view you have basically 4 ways to show data. I can show 90 days for the default, then 5, 10 and 30 if I choose. Just holding shift, ctrl or both will give me all the data I need. I have the truncated TTC averages there as well.
Example #7

For this image I ran around to the traders in the city I was in at the moment and talked to the banker. The Bonanza average is 211 after adding people selling Platinum Ounces for more then 300 gold. Because again people love to list things for 3 to 9 times the amount to artificially drive prices up.
With 74 listings after trimming outliers the Bonanza average is 211. Which is close to what I mentioned from TTC. So anything selling between 180 to 210 is probably reasonable and not an inflated price.
It took me longer to get the screen shots and make this post then it took me to observe the data. It took me longer to get the Bonanza data then I needed. I could have done the same with probably just the guilds I am in. Which further illustrates that it is simply unnecessary to be the library of congress of data, completely unnecessary to export data from MM although it's an option, and completely unnecessary to add all your exported data to spreadsheets to draw pretty lines.
I was able to figure out a reasonable price was 180 to 210 with only the MM UI, without a year of data, without other trading mods, and only in game data in a matter of minutes. Not the hour that it took me to put this post together.
Example #8
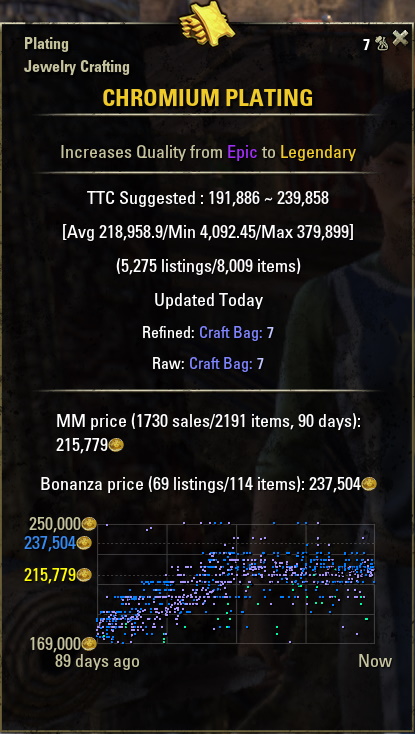
This image is from September of 2021 that I put in my documentation.
Example #9

This image is MM version 3.7.67 with the same current data I have.
Example #10

Current version outliers off.
Example #11

Current version trim outer percent set to 5%.
Example #12

Current version trim outliers
Example #13

Current version trim outliers with more aggressive boundaries.
Summary
As I already explained. Nothing changed. Update 39 did not cause anything to change. The updates to the versions did not cause anything to change. It is a complete waste of your time and mine to discuss this.
Comparing the prices to September 2021 to now is useless. People are posting things at any price they can get people to buy the item for. People post with any price that will intentionally pollute MM and TTC data and then they buy and sell to themselves or work with other people to artificially skew prices.
If you want that to change, then post on the official forums and see what kind of feedback you get. I don't feel you will get any useful feedback if they don't flat out laugh at you. However, feel free to do so if you choose.
The graph functionality has not changed, how people price things has changed. I have no control over that and I'm completely disinterested in worrying about it because I have no control over what people do. You don't either, so unlike the movie Frozen... let it go.
As for the rest...
I can't help you with something I can't control. If you want to express your concerns over how people list items the official ESO forums would be a great place. Some people may agree with you and you could get some empathetic feedback. In the end I don't think any post you make will change the situation.
In my opinion we are on the cusp of price gouging and price controlling unlike we have seen in the past. The values of crowns per gold for selling crowns is on the rise and the fact ZOS doesn't control that has an impact on the amount of gold in circulation. Especially whey there are middlemen that receive a portion of the transaction. For doing basically nothing but brokering a possible secure transaction. Trader competition and guilds using multiple accounts to bid on multiple Kiosks to eliminate competition is also a factor. The only way any of that will change is if ZOS comes up with an idea to cull that kind of behavior. Which I don't see them doing.
So thanks for the question, it isn't anything I can control and the data you have is just data and the graph just represents the data you have collected.